We Got a Perfect 100 on Google PageSpeed — Here's Exactly What It Took
A perfect PageSpeed score isn't luck — it's engineering. Here's the exact checklist Uniqode uses to hit 100/100 on every website we build, and what it means for your business.
What Is Google PageSpeed Insights — And Why Should You Care?
If you've ever Googled your business and wondered why a competitor ranks higher despite having a worse-looking site, PageSpeed Insights (PSI) might be the answer you haven't checked yet.
Google PageSpeed Insights is a free tool that analyses any URL and scores it from 0 to 100 across four categories: Performance, Accessibility, Best Practices, and SEO. The Performance score is the headline number — and it's one of Google's confirmed ranking signals.
But here's the thing most business owners miss: a slow website doesn't just hurt your Google ranking. It directly costs you customers. Google's own research found that as page load time increases from 1 to 3 seconds, the probability of a mobile visitor bouncing increases by 32%. At 5 seconds, that figure jumps to 90%.
For a Singapore SME spending money on Google Ads or social media to drive traffic, sending that traffic to a slow website is like pouring water into a leaky bucket.
What Does "100 on PageSpeed" Actually Mean?
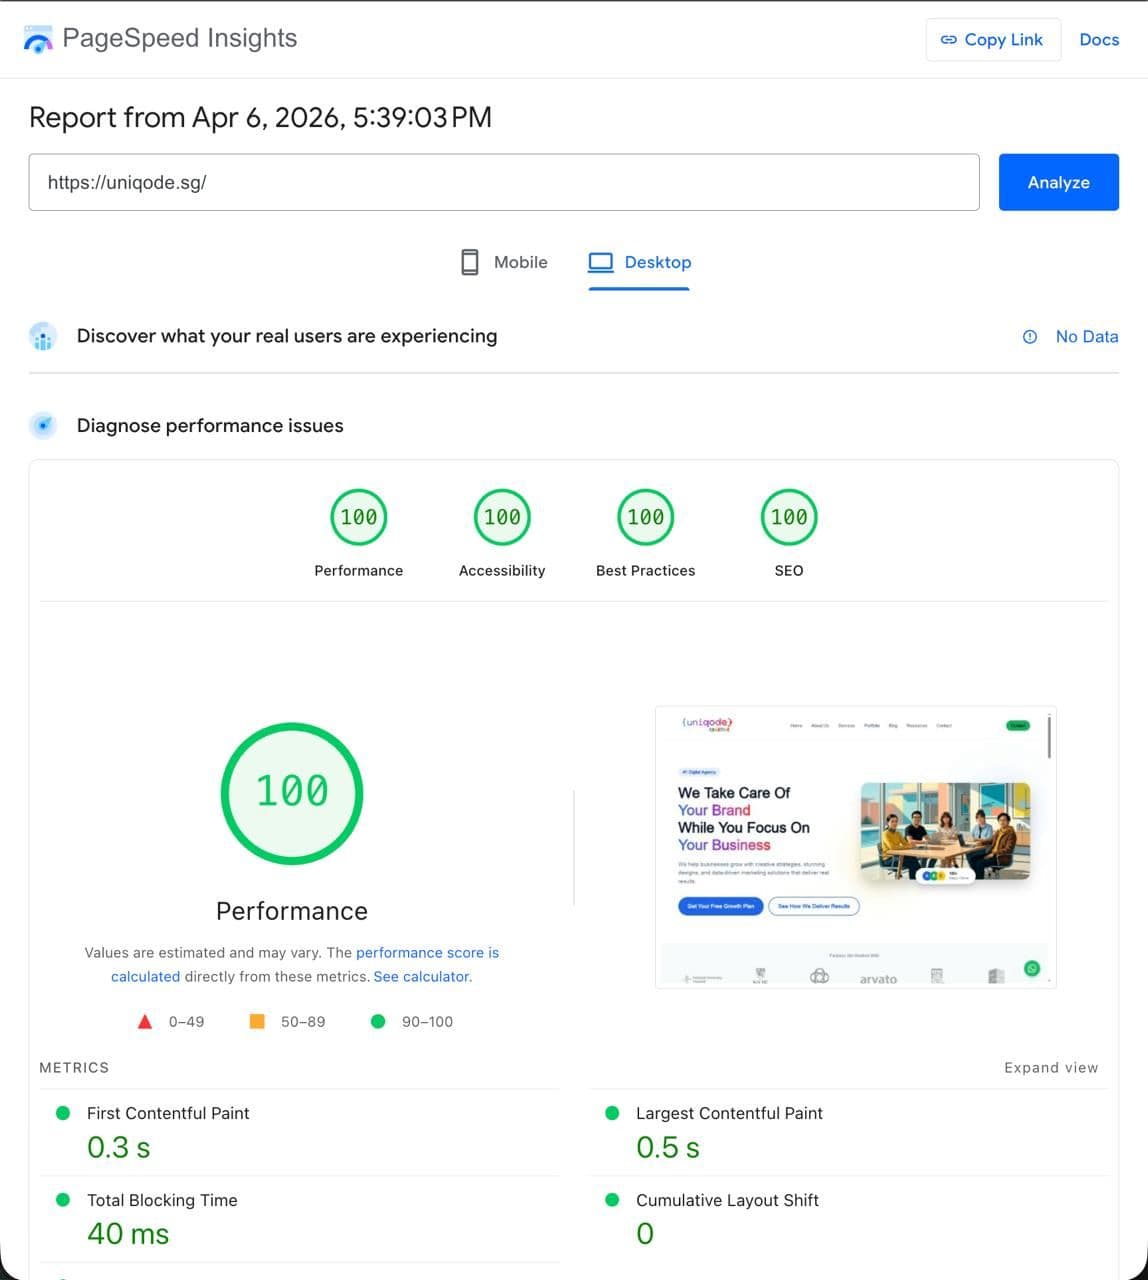
A score of 100/100 means your website is in the top percentile of performance on the web. It means:
- Your Largest Contentful Paint (LCP) — how quickly the main content appears — is under 2.5 seconds
- Your First Input Delay (FID) and Interaction to Next Paint (INP) — how fast the page responds to clicks — are near-instant
- Your Cumulative Layout Shift (CLS) — how much the page "jumps around" while loading — is virtually zero
- Your pages are fully accessible, follow web standards, and are crawlable by search engines
These four metrics form Google's Core Web Vitals, and they feed directly into your search ranking.
When we built Uniqode's own website, we made a deliberate decision to treat performance not as an afterthought but as a core deliverable — the same way we do for every client site we build.
The Exact Stack We Used
Getting to 100 starts with the right foundation. Here's ours:
Next.js with Static Site Generation (SSG)
We built the Uniqode website on Next.js using Static Site Generation wherever possible. Instead of rendering pages on the server every time someone visits, SSG pre-builds all pages at deployment time and serves them as static files from a CDN.
The result: pages that load in milliseconds, with no server processing time.
Deployed on Vercel's Edge Network
We deploy on Vercel, which serves files from edge nodes closest to the visitor. A user in Singapore is served from a Singapore data centre. A visitor in the US gets the US node. No round-trips to a single server on the other side of the world.
This alone cuts 300–500ms off load times for international visitors — which matters if you're a Singapore business reaching clients across Southeast Asia.
Images: The Biggest Performance Win
Images are the number-one cause of slow websites. Most business websites are dragged down by:
- Oversized images (2MB+ photos served at thumbnail size)
- The wrong format (JPEG/PNG instead of modern WebP or AVIF)
- No lazy loading (loading every image on the page even if the user never scrolls down)
Here's what we did instead:
- WebP and AVIF formats — typically 30–50% smaller than JPEG at the same visual quality
- Responsive images — we serve different sizes depending on the device (a mobile phone doesn't need a 2400px-wide hero image)
- Lazy loading — images below the fold only load when the user scrolls toward them
- Priority loading for above-the-fold images — the hero image loads as early as possible so LCP is fast
Next.js's built-in <Image> component handles most of this automatically. You still need to get the source images right, but the framework does the heavy lifting.
Fonts: Zero Layout Shift
Custom fonts are a common source of Cumulative Layout Shift — that frustrating flash where text renders in a system font then suddenly jumps to the correct font, shifting everything else on the page.
We solve this by:
- Using `font-display: swap` so text is immediately visible in a fallback font
- Pre-loading font files so they arrive before the browser needs them
- Self-hosting fonts (no waiting for Google Fonts' servers)
- Matching fallback font metrics so the layout shift is imperceptible
The result: zero measurable CLS from fonts.
No Render-Blocking Resources
Every <script> tag in the <head> of a page blocks the browser from rendering anything until that script downloads and runs. Old-school websites — and many WordPress themes — are riddled with these.
We:
- Defer all non-critical JavaScript
- Load analytics (Google Tag Manager, etc.) asynchronously after the main content
- Inline only the critical CSS needed to render above-the-fold content
- Move everything else into lazy-loaded bundles
Aggressive Caching
Once a file is downloaded, there's no reason to download it again. We set aggressive cache headers so browsers and CDN nodes keep our static assets for up to a year. Only the HTML itself (which may change) gets a short cache time.
The Audit Process: How We Validate Every Build
A score of 100 isn't something you achieve once and forget. Every time we deploy, we:
- Run Lighthouse (the engine behind PageSpeed Insights) in CI/CD
- Check Core Web Vitals in Google Search Console for real-user data
- Run PageSpeed Insights on the live URL across both mobile and desktop
- Fix any regressions before the deploy goes live
Mobile scores are always harder than desktop — mobile devices are slower, on worse networks, with smaller screens. That's also where it matters most: over 60% of web traffic in Singapore comes from mobile devices.
We aim for green (90+) on mobile across all four categories. Hitting 100 consistently requires discipline — every new feature or image added to the site goes through the same checklist.
What This Means for Your Business
Here's the practical takeaway. A website that scores 100 on PageSpeed Insights:
- Ranks higher on Google — speed is a direct ranking factor, especially for mobile searches
- Converts better — faster pages keep visitors engaged rather than bouncing
- Costs less to run — efficient sites use less bandwidth and server resources
- Wins on Google Ads — Google's Ad Quality Score takes landing page experience into account; a fast landing page means lower cost-per-click
For Singapore SMEs running Google Ads — where every click costs between $1 and $10 — a faster landing page can meaningfully reduce your cost per lead.
The One Thing Most Agencies Get Wrong
Most web agencies treat performance as a bonus feature — something to "optimise later" if the client asks for it. The result is websites that look polished in the demo but struggle to load on a 4G connection in Tampines.
At Uniqode, performance is part of the spec. Every website we build is benchmarked against Core Web Vitals before it ships. We don't consider a website finished until it's fast.
If your current website scores below 50 on PageSpeed Insights — go check right now at pagespeed.web.dev — there's likely a meaningful improvement in your organic rankings and conversion rate waiting on the other side of a rebuild.
Ready to Build a Website That Actually Performs?
A 100/100 PageSpeed score isn't magic. It's the result of using the right technology stack, making the right architectural decisions, and holding the line on performance throughout the build.
If you want a website that ranks, loads fast, and converts visitors into customers — talk to Uniqode. We build websites the way they should be built.
Web Development
Need a website that converts?
We design and build fast, modern websites for Singapore businesses — from landing pages to full e-commerce stores.